Call History Icons
When looking in Call History, scrolling down will give you all the inbound and outbound calls for your organization. In the Conversion column, you will notice icons that may appear on a call. Example below. Hovering over each icon will give you a brief synopsis of what the icon does, and brief stats

Double Check Mark: Means a ‘converted sale’ occurred whether a product was purchased, or quotes with pricing was talked about with the implication a product or service is/will be provided. This gets tracked under AvidBit Intelligence with a graph.
Calendar: Means an appointment was set whether a specific date or time was mentioned for a service to be provided on.
Shopping Cart: A transaction happened on the call with a dollar amount. You will always see both the shopping cart and the dollar sign for transaction calls.
Dollar Sign: Price or cost was estimated on the call. Hovering over the icon gives you the dollar amount that was discussed on the call.
Check List: This means follow-up tasks were generated as things still to do.
Star: The call was considered high priority.
Graphs & Stats
Business Intelligence AI
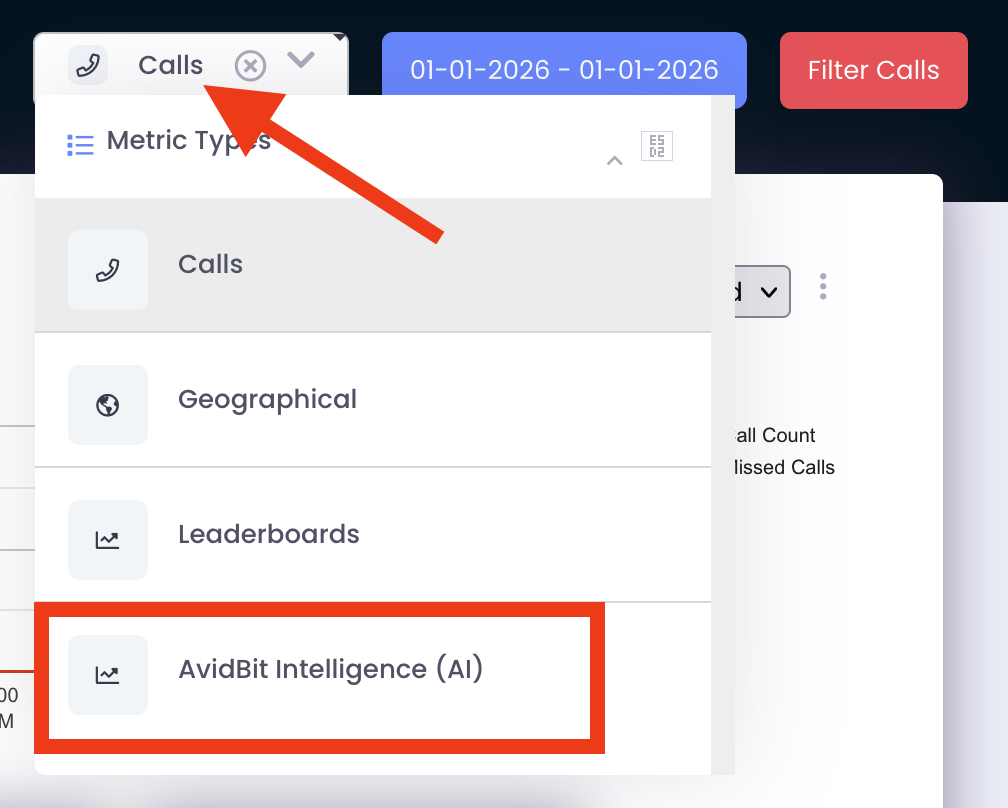
- Navigate to Apps -> Call History. To the left of the Date Range and Filter button in the top right corner will be a drop down menu that loads the Calls page by default. Click onto that drop down and select AvidBit Intelligence (AI).
2. Once on the AvidBit Intelligence page, change the Date filter to yesterday or earlier, as the AI does not run the current day, and then you should be seeing analytics like the ones below. You can make your date range bigger (e.g. 1 week, 1 month) and analytics/graphs will update to the time period selected.
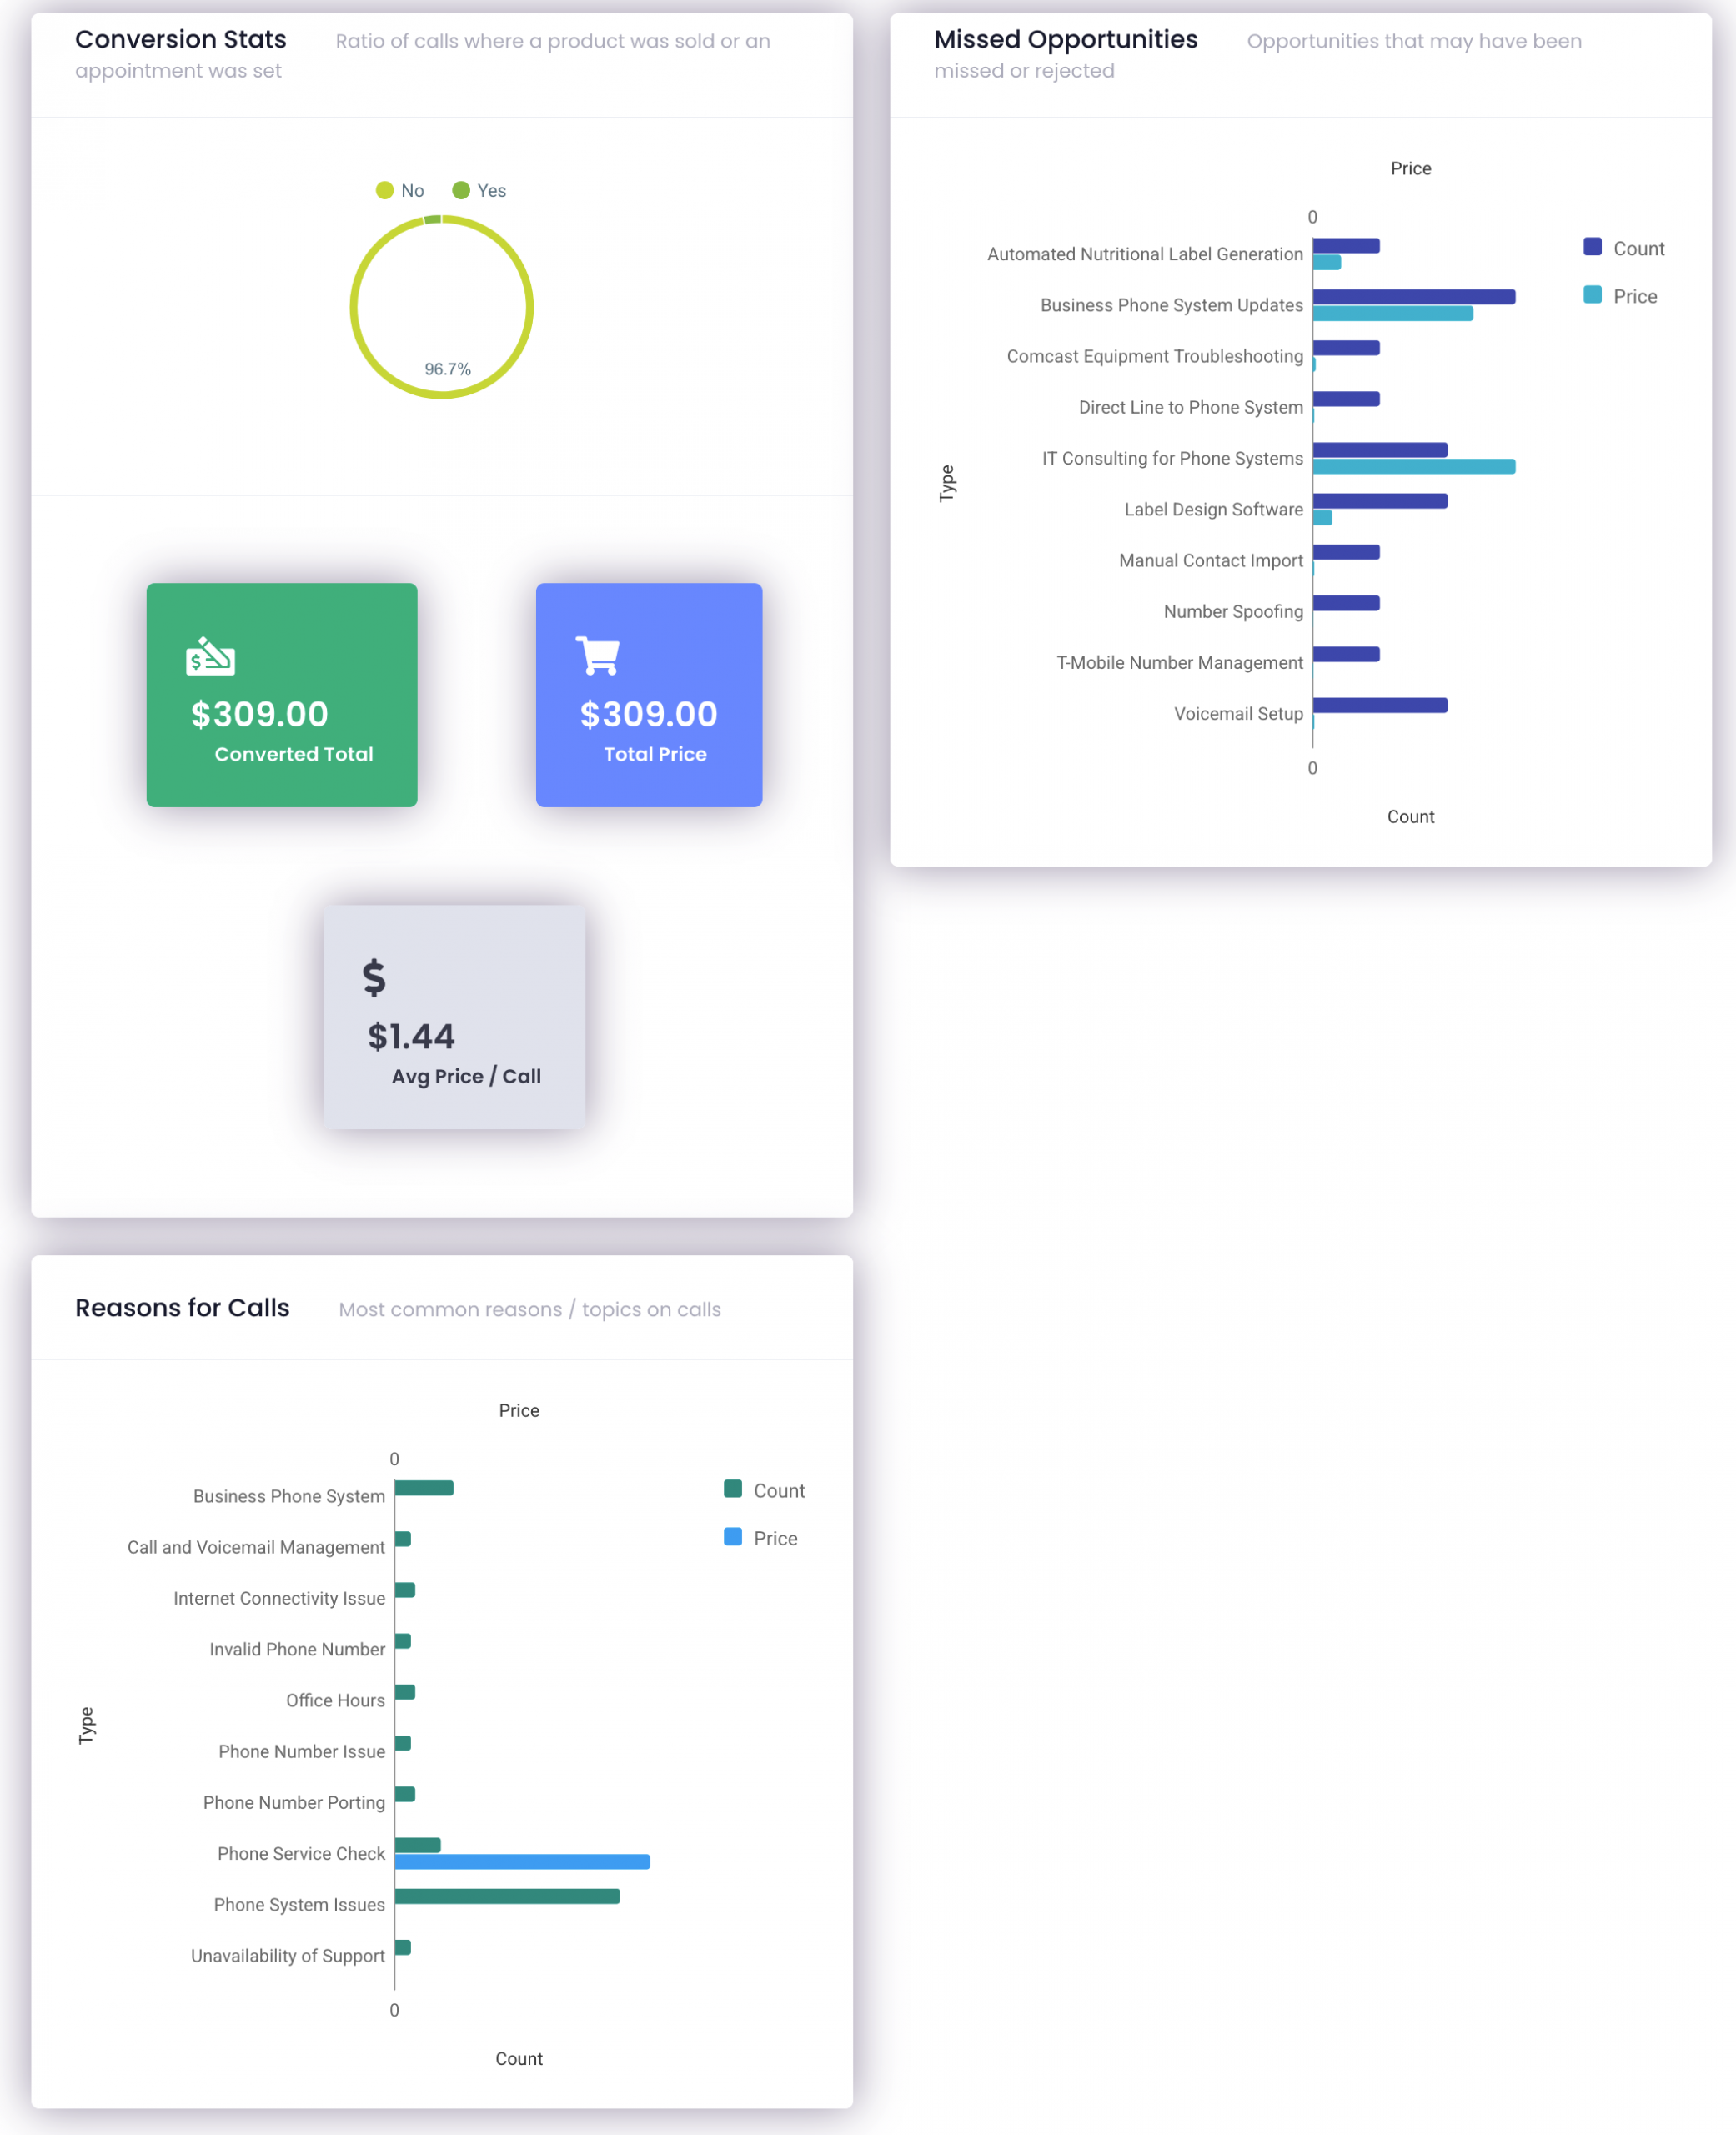
Conversion Stats: This watches and flags transactions, appointments scheduled, or other sales related items that indicate that a service was provided. AI asks, “Was the sale converted? How much was converted? Was an appointment set?”
If successful conversion happened like a transaction was made, or an appointment set, or the customer saying something like they’ll bring their car in, that counts towards your sales conversion rate. Even if price isn’t explicitly talked about, AI estimates the cost for items which are included in these analytics.
Missed Opportunity: Flags and counts the instances where the business couldn’t provide a product or service to the customer. E.g. “We can’t help you with this.” “We don’t have that product in stock.” This graph gives the topic of the call that an opportunity was missed on as well as the price of how much potential revenue was lost.
Reasons for Calls: This analyzes the most common reasons or topics for calls, both inbound and outbound. We also estimate the price or dollar amount that was talked about on the call(s).
Custom AvidBit Intelligence
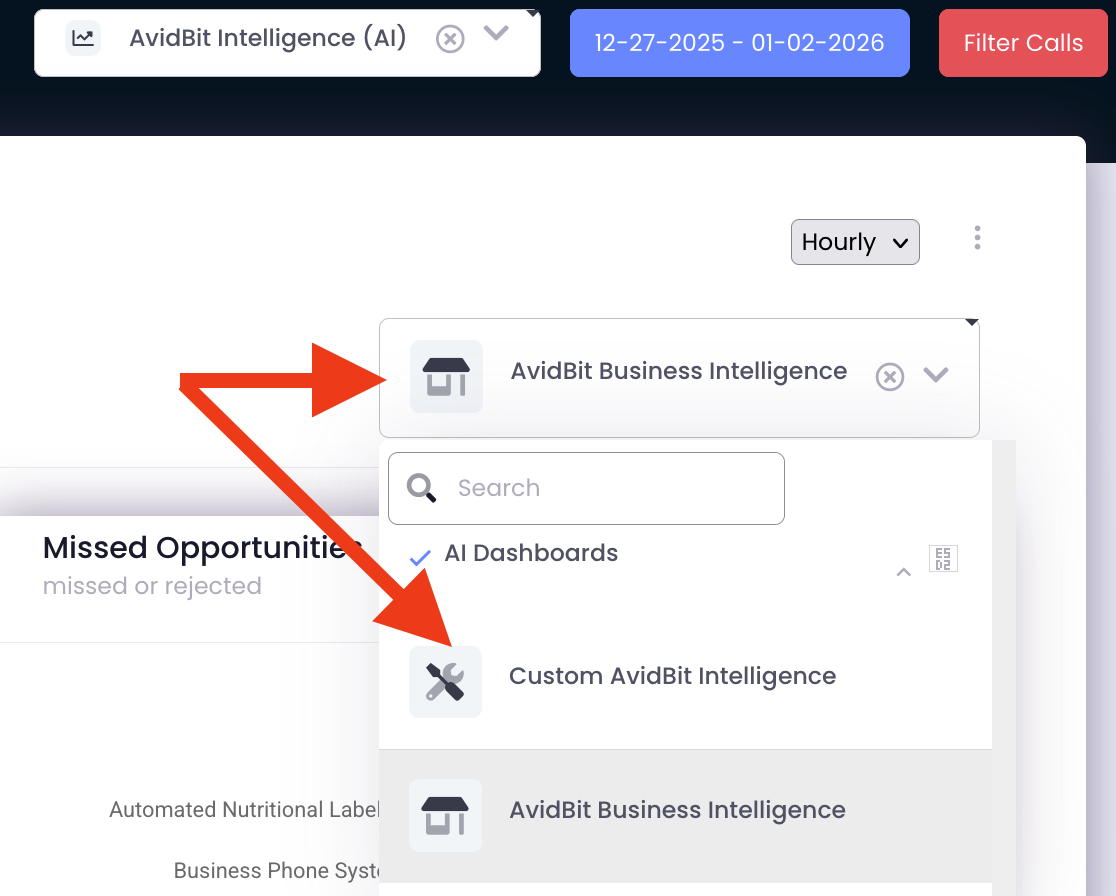
To see analytics and graphs of all custom requests created previously, switch the drop down menu within AvidBit Intelligence to show Custom AvidBit Intelligence instead of AvidBit Business Intelligence (see below).
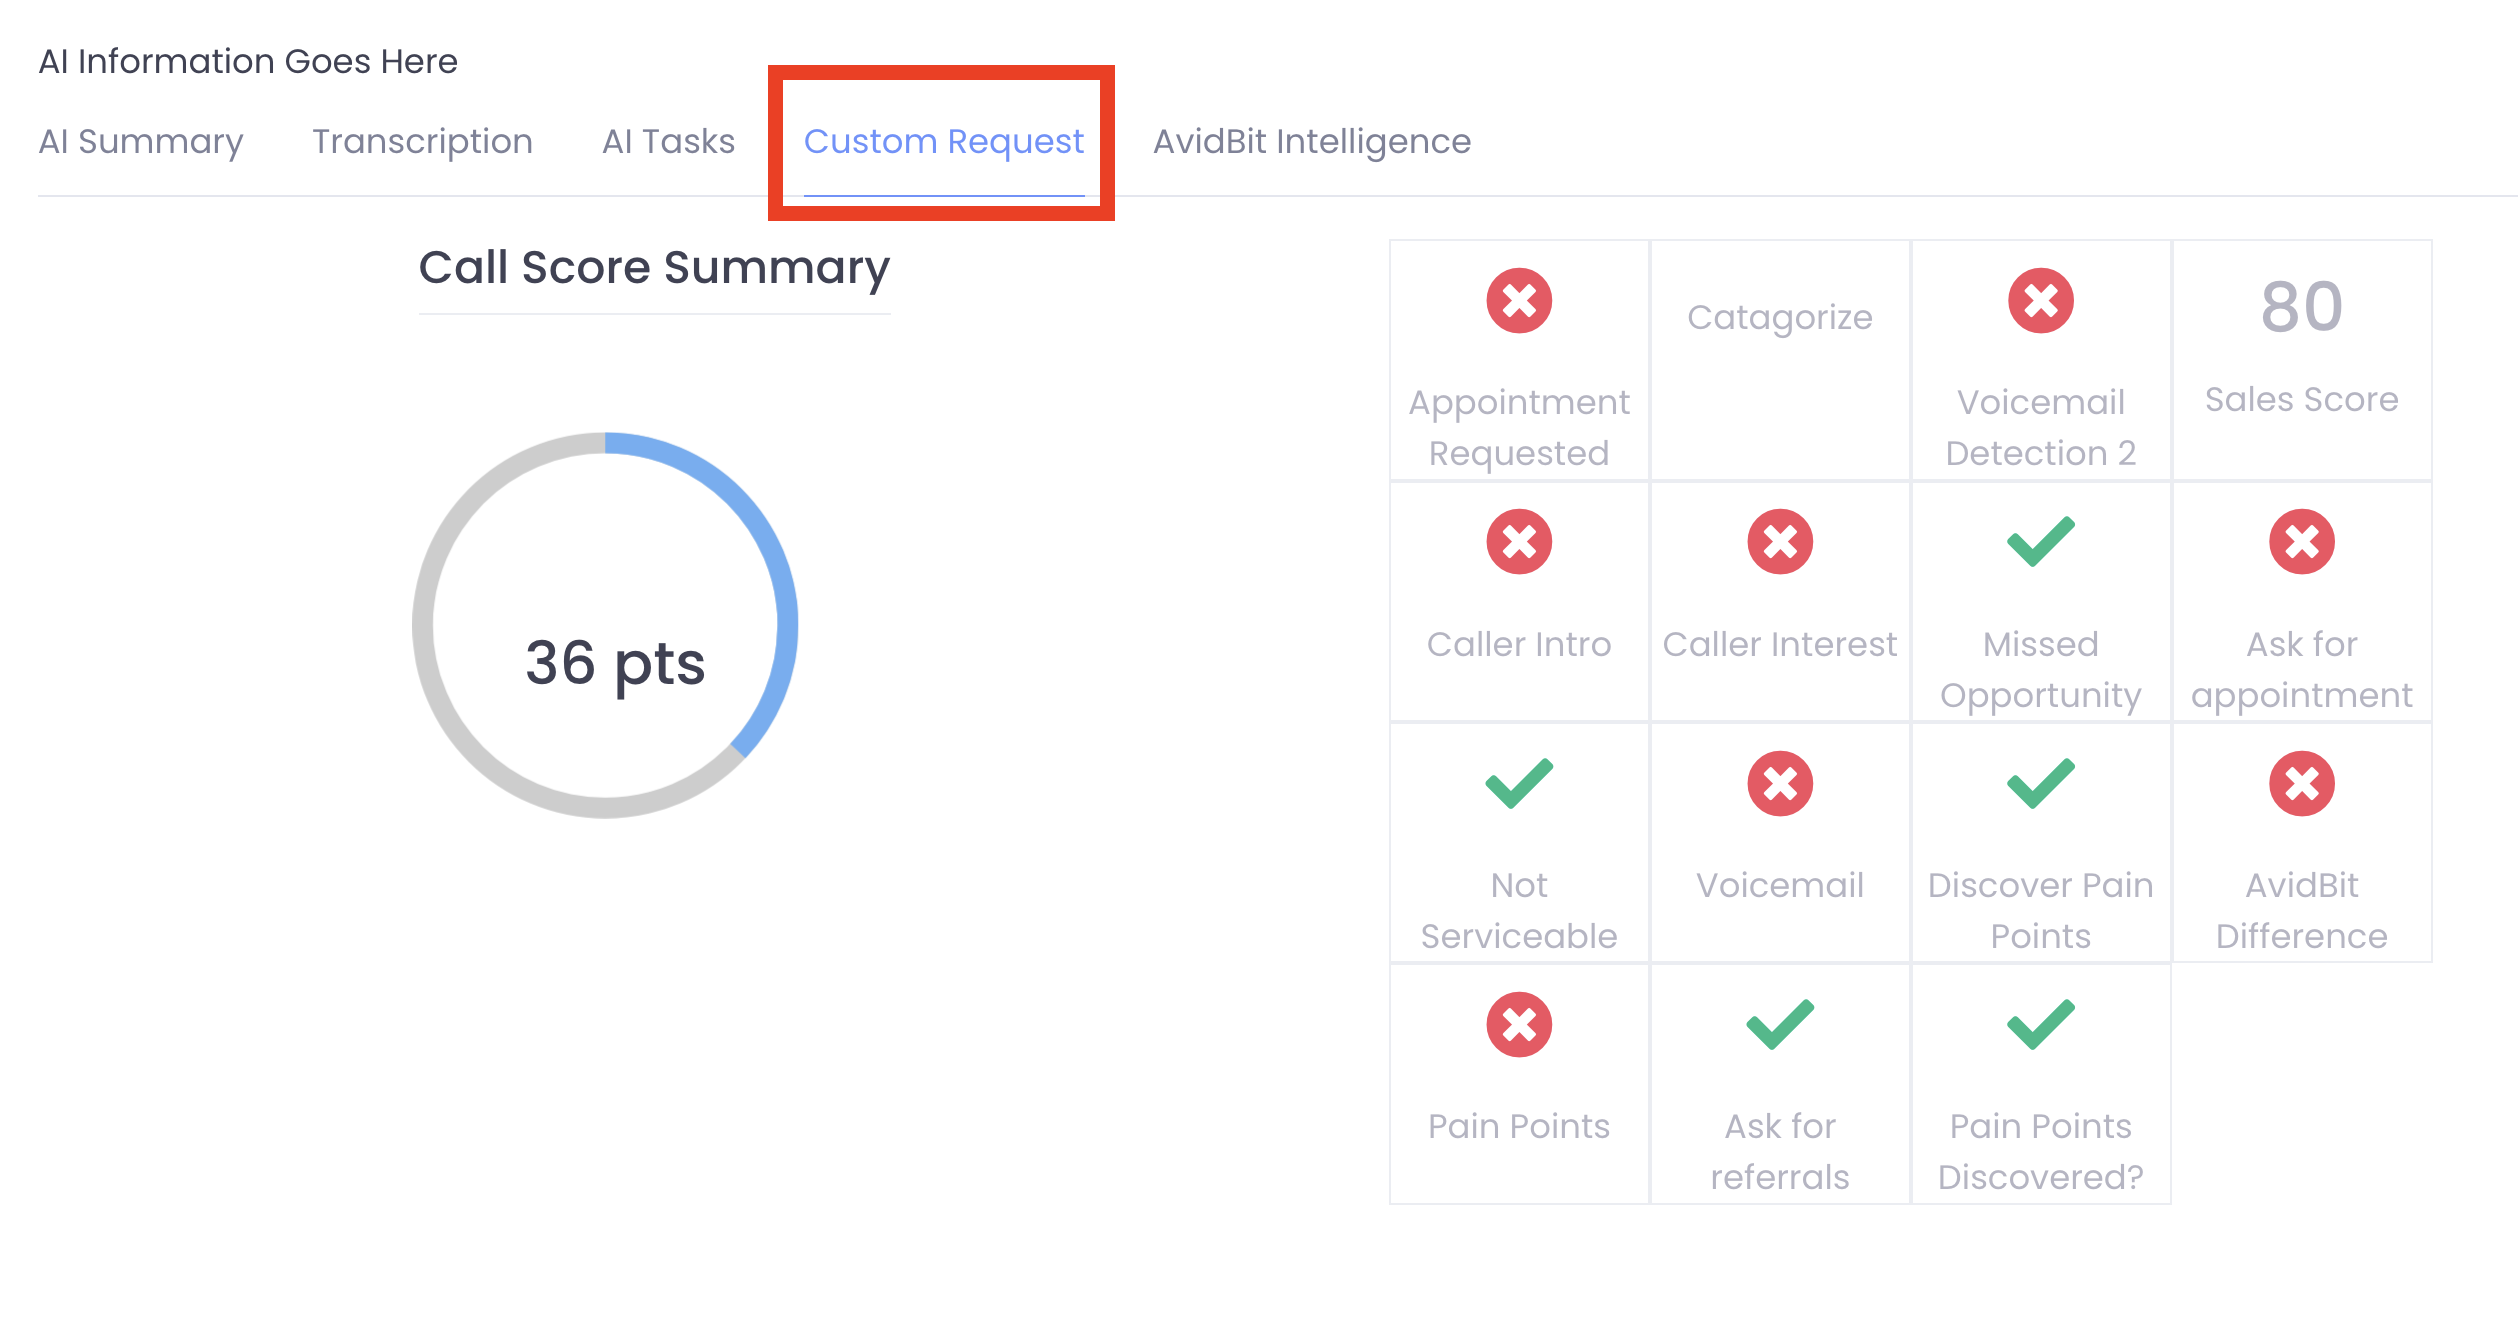
Custom Request Scorecard
– To view a quick scorecard analysis of Custom Requests previously made on calls, click the blue/gray circle on a call (see below) and click on the Custom Request tab. This provides a quick glance scorecard against custom requests.