
Analytics provide comprehensive monitoring capabilities for your phone system, allowing you to gain valuable insights into various key metrics including Call Quality, Answer Times, Call Queue, Hold Times, Leaderboards, and much more. This extensive section covers a wide range of analytics, enabling you to track the performance of your phone system in detail. Easily navigate to the specific section you need by utilizing the content links to skip to the relevant information.
Overview
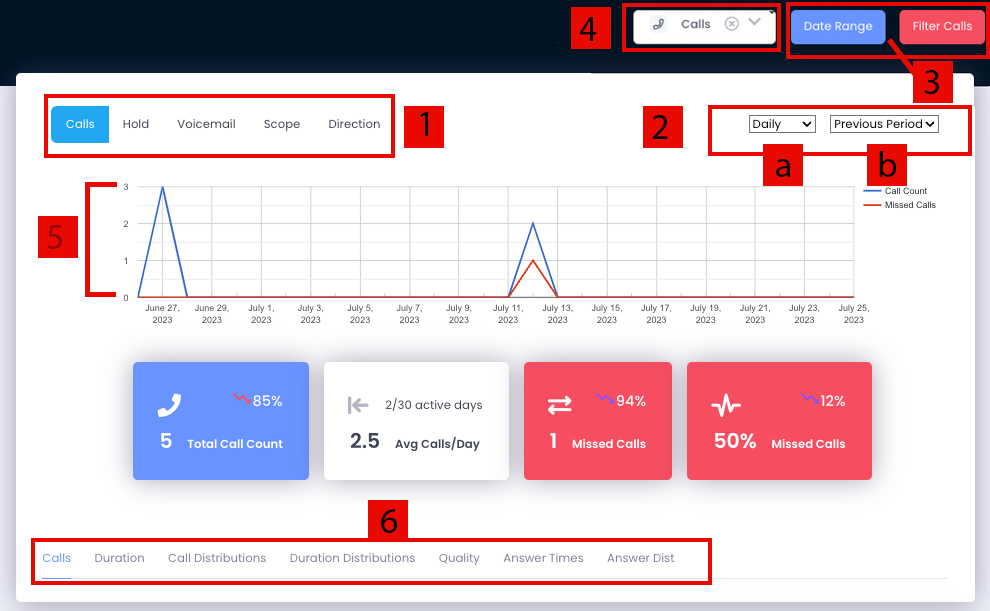
1. This specifies which kind of phone data that will be shown on your graphs.
- Calls
- Hold
- Voicemail
- Scope
- Direction
This will relate to any status on phone calls made or received during a period, including missed calls. It is a sum statistic for total call count irregardless of its direction or status.
This will provide information on calls that were placed on hold at any time during the phone call.
This relates to any phone calls that reached a voicemail box. This could be from a missed call and a voicemail was left, or it could be from transferring to a voicemail box directly and they proceed to leave a message.
This feature provides a detailed breakdown of the types of calls during a specified period. It categorizes calls as internal (calls made to another phone within the same organization), external (calls made or received outside the organization), and international.
Direction distinguishes calls received (inbound calls) vs calls made (outbound calls).
2. These drop down menus allow you to change how the graphs are broken up on the x-axis. The options available will change based on which subcategory is selected.
- 2A
- 2B
Selecting this drop down will give you every available option for that type of subcategory. Most commonly these will include: Hourly & Monthly. Notice how the x-axis populates based on the time frame you selected.
This lets you select a period in time to compare analytics with. If there is information available during that time period, you will see a percentage indicator in the colored boxes.
3. This selects which time frame the analytics are tied to. You also can use filters to narrow down your analytics even more. Applied filters will appear in a new box above the analytics indicating which filters are on. Notice that changing filters will also apply to the call history logs found at the bottom of the page.
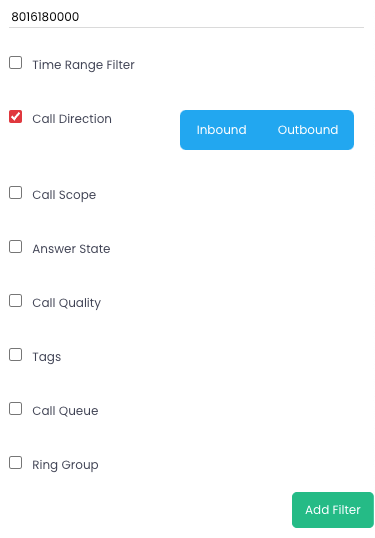
The image above is an example of what the “Filter Calls” pop-out looks like. Notice that you can use the custom search field to search for phone numbers, or names. Press “Apply Filter”. Applied filters will show up as blue boxes above the graphs. Click the ‘x’ to remove filters, and then “Update Filter” to refresh.
4. This drop down menu expands to other categories. You can select from Calls, Geographical, or LeaderBoards.
5. Displays the content in a graphical representation dependent on which subcategory that you have selected. E.g. The current figure represents the total number of calls on a particular day.
6. The subcategory field. Selecting a category here will update the graphical representation and provide specific analytics. These subcategories will be broken down in this article.
Duration
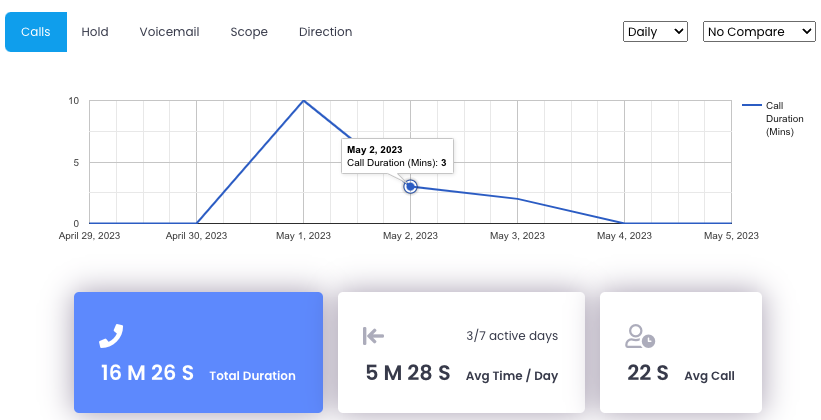
This provides details on the duration of calls in terms of minutes. Selecting an option along the top horizontal bar will provide additional graphs to analyze.
Call Distributions
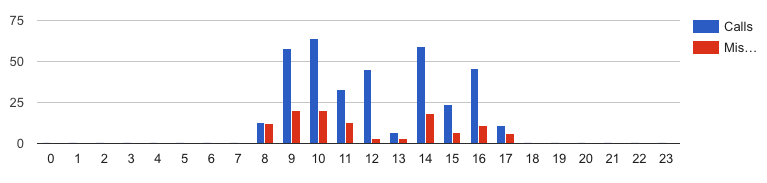
This is one of the best ways to do comparisons on calls vs missed calls over different time periods.
- Hourly: Based off a 24 hour schedule, 0 corresponds to 12 a.m. and 23 corresponds to 11 p.m.
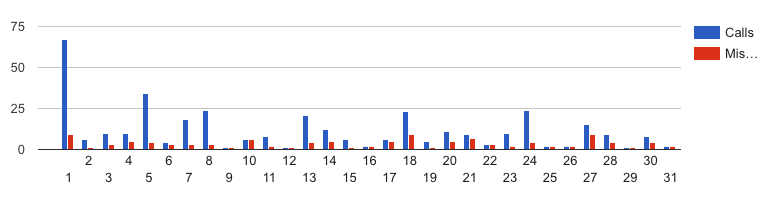
- Daily: Based off a monthly schedule, this breaks down the month by days. If more than one month is being viewed, these will provide a sum total of calls on that day of the month. The figure below uses a ‘Year To Date’ view.
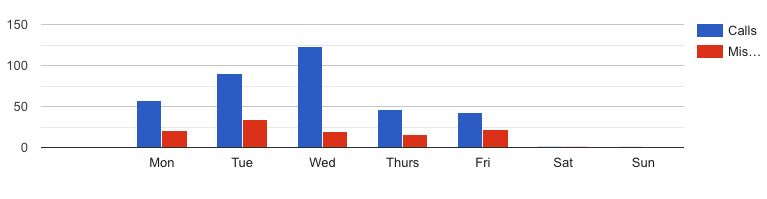
- Weekly: This shows a graph from Monday – Sunday and populates the data based on the date range selected. In other words, if you have selected ‘Year To Date’, all the calls will be grouped by day of the week, providing a breakdown on when the busiest times tend to be.
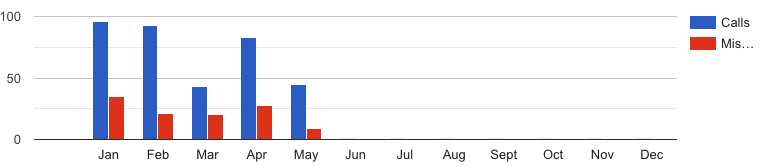
- Monthly: Broken down by months. If the current filter extends past a year, the statistics will become a sum total of the combined years.
Hourly:
Daily:
Weekly:
Monthly:
Duration Distributions
This graph is a representation of the amount of time spent on a particular call.
Geographical
Provides a geographical map of the U.S. with color coding provided for seeing the geographical distributions of phone calls.
Quality
Quality provides a quick glance to the overall quality of the calls. It provides a quick glance for average call quality, as well as showing where dips in call quality happened during the date range.
Answer Times
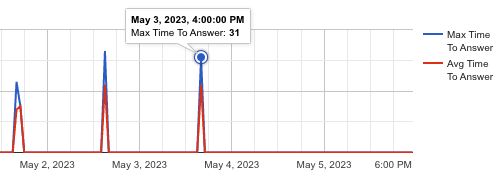
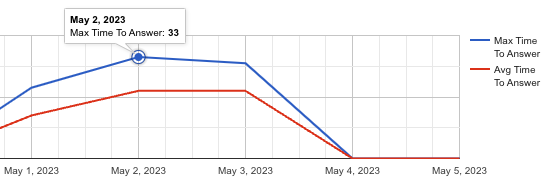
This breaks down both the maximum and the average time it takes to answer calls. Selecting the drop down box will provide you with many versions of this graph. Hovering over spots on the graph will provide additional details. The ‘Hourly’ and ‘Daily’ graphs are especially useful.
Answer Distributions
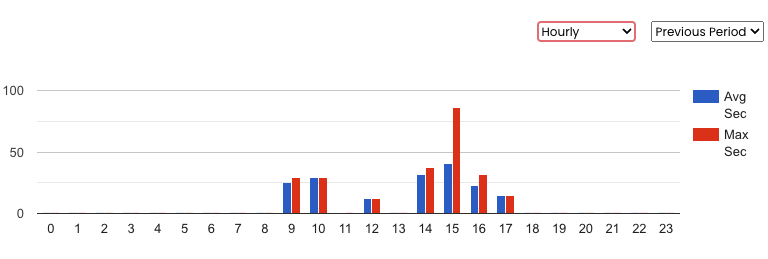
Answer distributions also provide a graphical representation of answer time using bar graphs. These graphs can be further broken down into Hourly, Daily, Weekly, and Monthly. It gives similar data to Answer Times, but in bar graph format. These provide key insights into when your busiest times typically occur.
Hourly:
LeaderBoards
Leaderboards provide an overall snapshot of the performance of users including number of group calls answered, time spent on the phone, etc.

Location
This uses the same metrics as the LeaderBoards, but rather than breaking it down by users, it will show you how your entire location is performing.
Numbers
This shows most of the same analytics for LeaderBoards, but is broken down by which number was called. This includes direct dial numbers.
